Thermo analysis procedure allows you to simulate field of temperature dynamically changing due to thermal processes. Following types of thermo process are simulated with Application: heat exchange between contacting Elements of Optical System and heat transfer with radiation. Note convection processes are not covered with current Application.
Simulation of dynamically changing fields is the principal difference between Illumination Analysis and Thermo analysis modes. During heating, Element will start re-radiate acquired heat affecting overall picture of thermal conditions until thermodynamic equilibrium will be reached.
Before starting thermo analysis procedure you have to set Thermal Properties of each Element you want to be token into account within Optical Scheme and define global Thermal Settings for whole Project.
Whole procedure of Thermo Analysis of your System from initialization of calculation routine till analysis of results can be performed using Properties of Radiation Surfaces window.
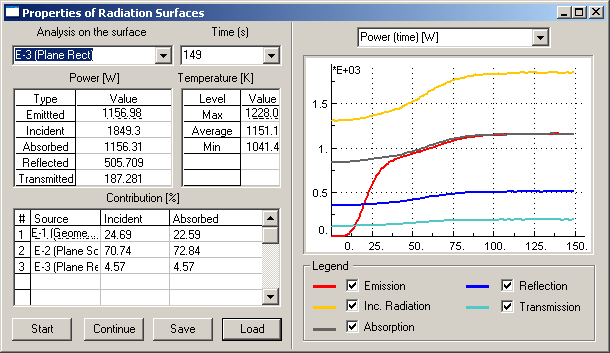
New window shown below will appear immediately:
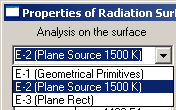
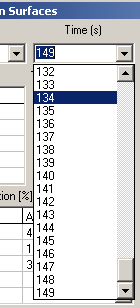
Window consists of several parts. Left part is responsible for choosing of Element of Optical Scheme to be analyzed and currently analyzed time graduation and contain numerical energy and temperature characteristics.
There are control buttons at the bottom of the left part of window, also.
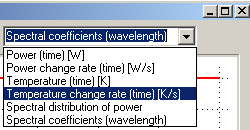
Right part of window contains graphical charts to be used for analysis purposes. You can choose desired chart type from the list at the upper of right part of window that will be displayed at the center chart window. Following types of charts are available:
Chart Legend is placed at the bottom of right part of window.
To start thermo analysis procedure:
Thermo analysis routine will start immediately. To monitor analysis procedure flow you can use messages appearing into Status Bar of Application window:
|
|
|
Initializing model parameters |
|
|
|
Initializing surfaces |
|
|
|
Ray Tracing progress |
You can interrupt calculation routine anytime you want by pressing Esc key on your keyboard. After it, you can either continue calculations by pressing Continue button at Properties of Radiation Surfaces Window or restart calculation routine from beginning with pressing Start button.
During calculation routine, you will get results corresponding to currently chosen Element of Optical System. At the left part of Properties of Radiation Surfaces window numerical values will be displayed while at the right part graphical representation of analysis results will be provided.
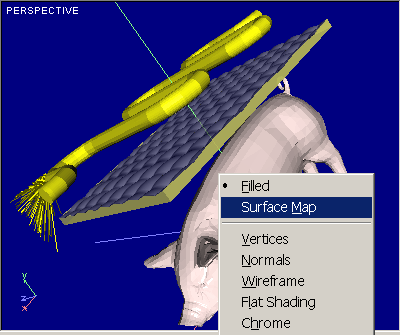
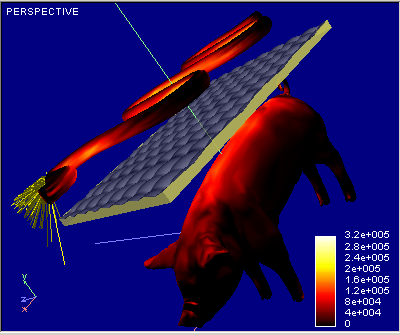
In addition, you are able to visualize results of thermo analysis you using Surface Map option of visualization available with 3D Viewer.
To visualize results of heat transfer procedure using Surface Map option:
Example of visualization result is illustrated with figures below:
|
|
|
Filled mode |
Surface Map mode |
you are able to save results of thermo analysis for following using and reload it anytime you want.
To save analysis results:
Results will be saved using internal Application srp format. Please don't try to edit saved file using any external editor.
To load preliminary saved analysis results: